','..','$myPermit') ?>
SYLLABUS Previous: 1.2 Capital and markets
Up: 1 INTRODUCTION
Next: 1.4 Modern portfolio theory
','..','$myPermit') ?>
SYLLABUS Previous: 1.2 Capital and markets
Up: 1 INTRODUCTION
Next: 1.4 Modern portfolio theory
Before we look into more advanced securities called
derivatives
because their value can be derived from others, it is useful to review
some of the conventional assets held in a portfolio.
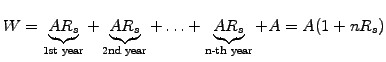
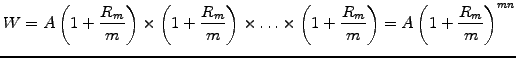
For example, take a 1% monthly rate of a unit investment: depending on the compounding, this translates into WAPR=1.01 x 12=1.12, WAPY=1.0112=1.126825, which approaches the continuous annual value of W=exp(0.01 x 12)=1.1275. In other words, the return has an APR of 12% and an APY of 12.68%. Brokerage houses often insure a single certificate of deposit for up to EUR 500,000. The main disadvantage of a certificate of deposit is that it locks up the money for a long time unless a steep penalty is payed... up to half of the return from the interest rate!
A large variety of funds pursue different investment strategies (countries, industries, risk levels, ethical factors): on Feb 23, 2002, the Financial Times newspaper listed more than seven pages with funds... more than shares! In this context, it is good to remember that market indices (such as FTSE-100, Russel 1000, NASDAQ-100) are by definition an arithmetic average; since funds now represent a larger fraction of the market, it is clear that roughly half of the funds under-perform that index. Pursuing a variety of often contradicting strategies can nevertheless be exploited by the marketing departments of the management firms, who simply highlight even few funds that outperformed the index to advertise the skills of all the managers.
In the real world, the spot price of a bond is determined by the offer and demand from investors and depends also on the credit worthiness of the issuer. Rating agencies such as Standard & Poor, Moody's or KMV use different criteria to judge issuers who are labeled from the safest ``investment grade'' (AAA, AA, A, BBB, of which 2.95% American corporate bonds defaulted in 2002) down to ``speculative'' (BB, B, CCC, CC), ``junk'' or ``default'' (C,D). The price of a bond drops sharply when the risk of defaulting on a debt rises: check the historical value of the Argentinian government bonds as its credit worthiness was finally downgraded from C to D in December 2001.
The spot price quoted for a variety of bonds can be accessed with
a dozen minutes delay free of charge over the Internet (take e.g.
Yahoo,
Bloomberg, etc)
and the closing prices are reported one day later in the press:
for example, on Feb 23, 2002, the
Financial Times
printed the values in 1.3#tab.1.
|
The first row shows a Swedish government bond that matures Jan 2009 and pays a 5% annual coupon: with a good investment grade AA+ and a yield in line with the market's expectations, the price (given as a percentage of the principal value of EUR 1,000) is 0.154% higher than the principal. If you bought this bond on Feb 22, you would now earn 0.03% less than the original coupon.
Marconi's corporate bond expires March 2010 and pays a coupon of 6.375%; after the downgrade of telecom operators and speculations about the company's financial fitness, the coupon is now well below what the market expects for the speculative B+ rating. This explains why the bond lost 65% of its principal value and was now only worth 35.00. If you bought this bond on Feb 22, you could earn a very high yield of 26.73% during the next 10 years, provided that the company does not go bankrupt in the mean time.
Small systematic costs have a large impact on the long term return of a portfolio: investors should never neglect the possibility of tax reductions or outright exemptions when buying municipal, state or government bonds.
In many countries, the tax on dividend income is higher than the tax on the gain in capital - although recent modifications of the taxation in the US may revert this trend. Shareholders therefore prefer to keep the dividend yield low and let the value of shares grow with the company as long as growth remains possible. The valuation of the company's assets, together with the latest results and the expectation of future earnings directly impact on the offer and demand from investors on the stock market (such as NYSE, NASDAQ) which ultimately determines the price of shares.
The spot prices quoted for every share can be read free of charge
on the Internet after only a dozen minutes delay (take e.g.
Yahoo,
Bloomberg,
etc) and the closing prices are reported one day later in the press:
for example, on Feb 23, 2002, the
Financial Times
printed the values in 1.3#tab.2 below.
|
AstraZenca pharmaceuticals have been growing very fast during the last years and, expecting that this will continue into the future, investors are willing to pay a much larger price-to-earning ratio of 29.9. For the sake of simplicity, assume that the exponential growth reached from the Low to the quoted Price during exactly one year, so that the growth rate can be estimated from G=ln(P2/P1)/(t2-t1)=ln(3519/2724)=0.25. This translates into astronomical returns G+E/P=0.25 +0.033=0.28 which exceed by far the 3.3% justified by the earnings and the 1.4% payed as dividends.
Finally, note the near collapse of Marconi's share from GBP 800 to 16.75, which shows that the company has large financial difficulties and may go bankrupt, i.e. the share value drop to zero forever. This is consistent with the low credit worthiness perceived for its corporate bond (1.3#tab.1) and underlines the fact that a high investment risk can lead to large losses.
Intra-day prices can in general not be accessed free of charge; daily values adjusted for occasional splits can, however, be downloaded using the MKTSolution applet below.
From this overview, it should be clear that a higher return can be expected if the investor accepts a larger risk. The comming sections describe simple methods to maximize the return from a portfolio and determine the risk from historical data. But how much risk should an investor take anyway? A mountaineer says this a matter of taste, while common sense tells you not to wake up in the middle of the night to worry about a portfolio!
SYLLABUS Previous: 1.2 Capital and markets Up: 1 INTRODUCTION Next: 1.4 Modern portfolio theory